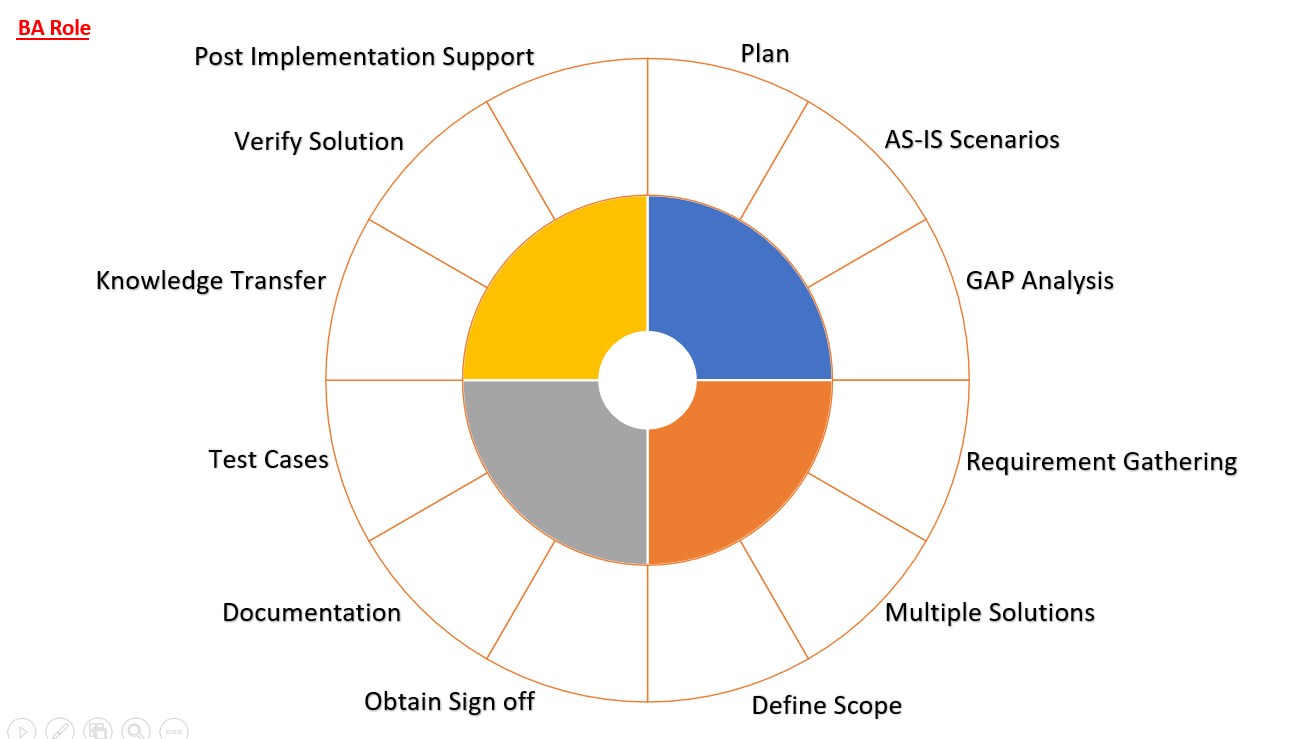
Wheel Diagram for BA Role
Make presentations interesting by presenting data and information with diagrams instead of using the regular text-based slides.
One can use circular diagrams or wheel diagrams to present business concepts, strategies and ideas in an interesting way.
You can also use a Wheel Diagram to represent a role and the associated responsibilities.
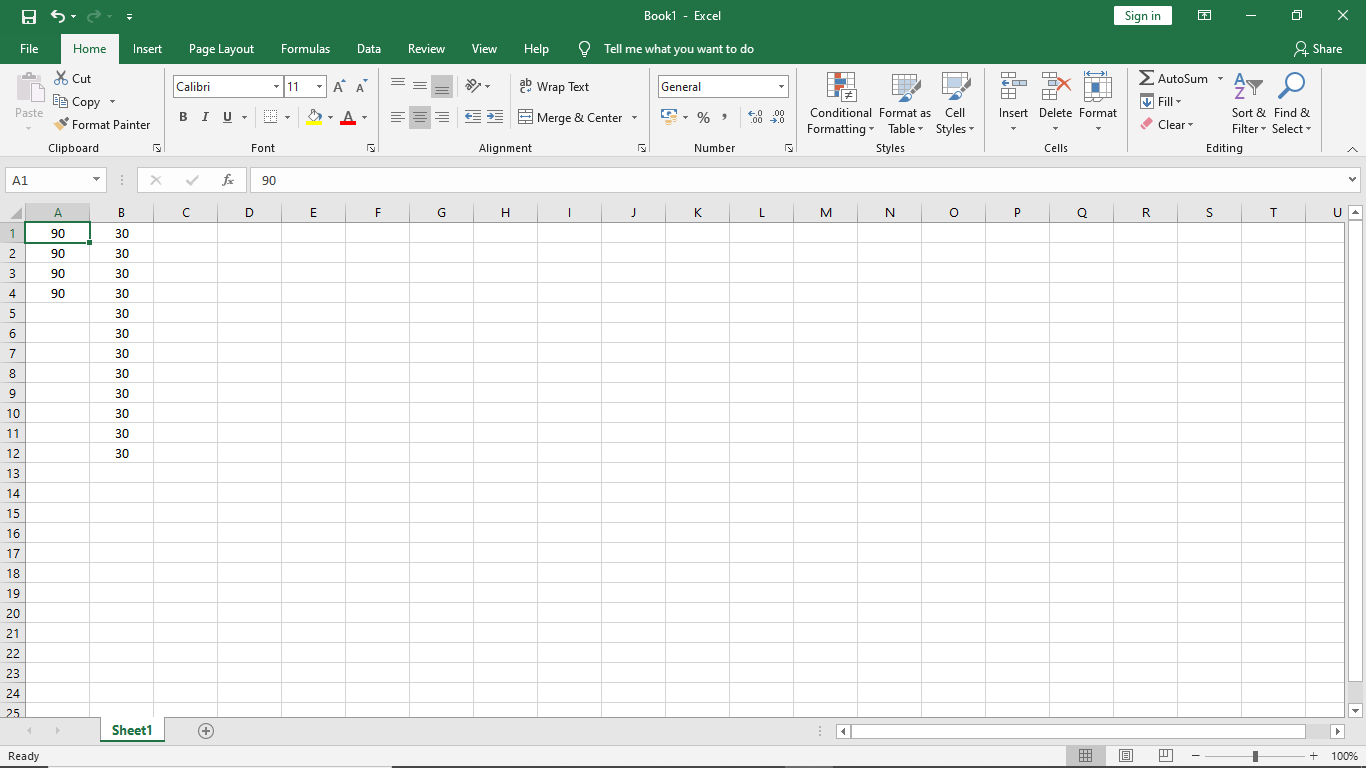
Step1: Open an Excel Worksheet and enter column values for inner wheel and outer wheel
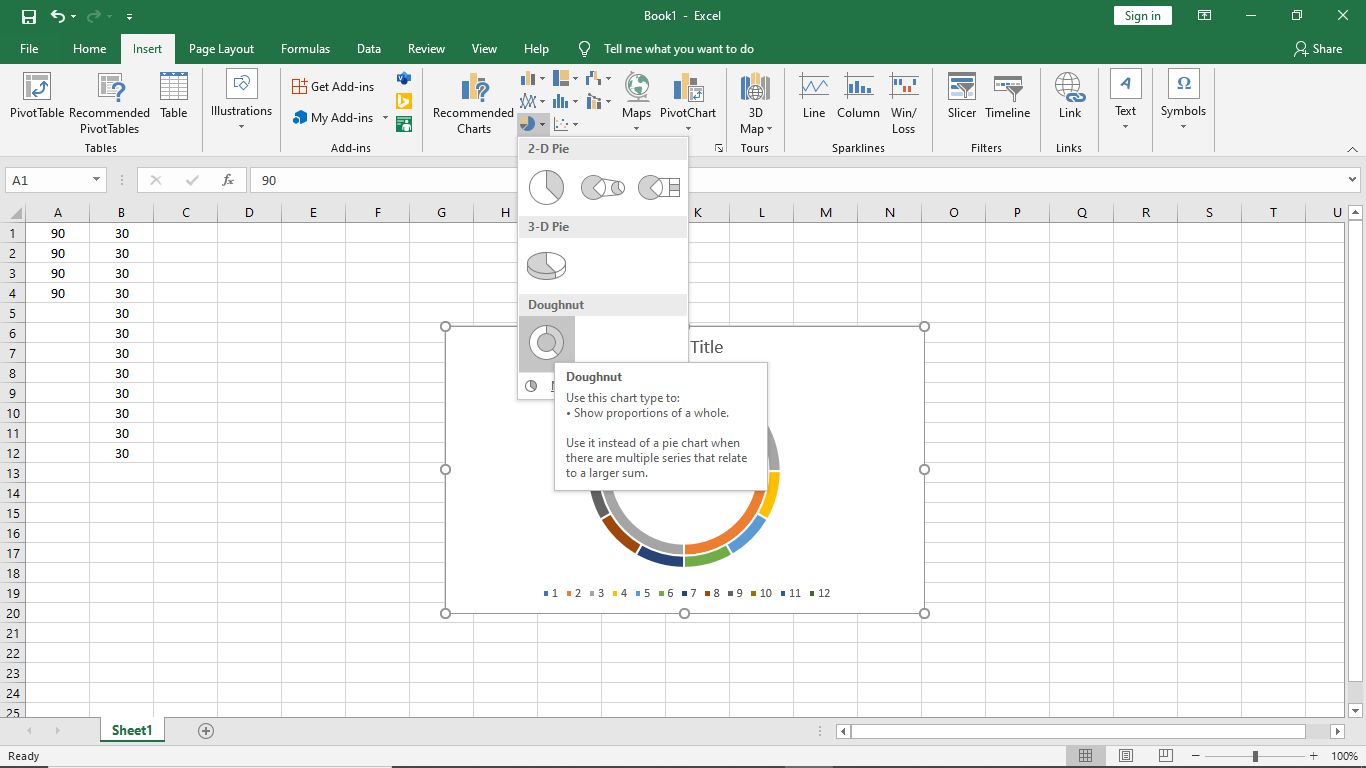
Step2: Insert Doughnut Chart
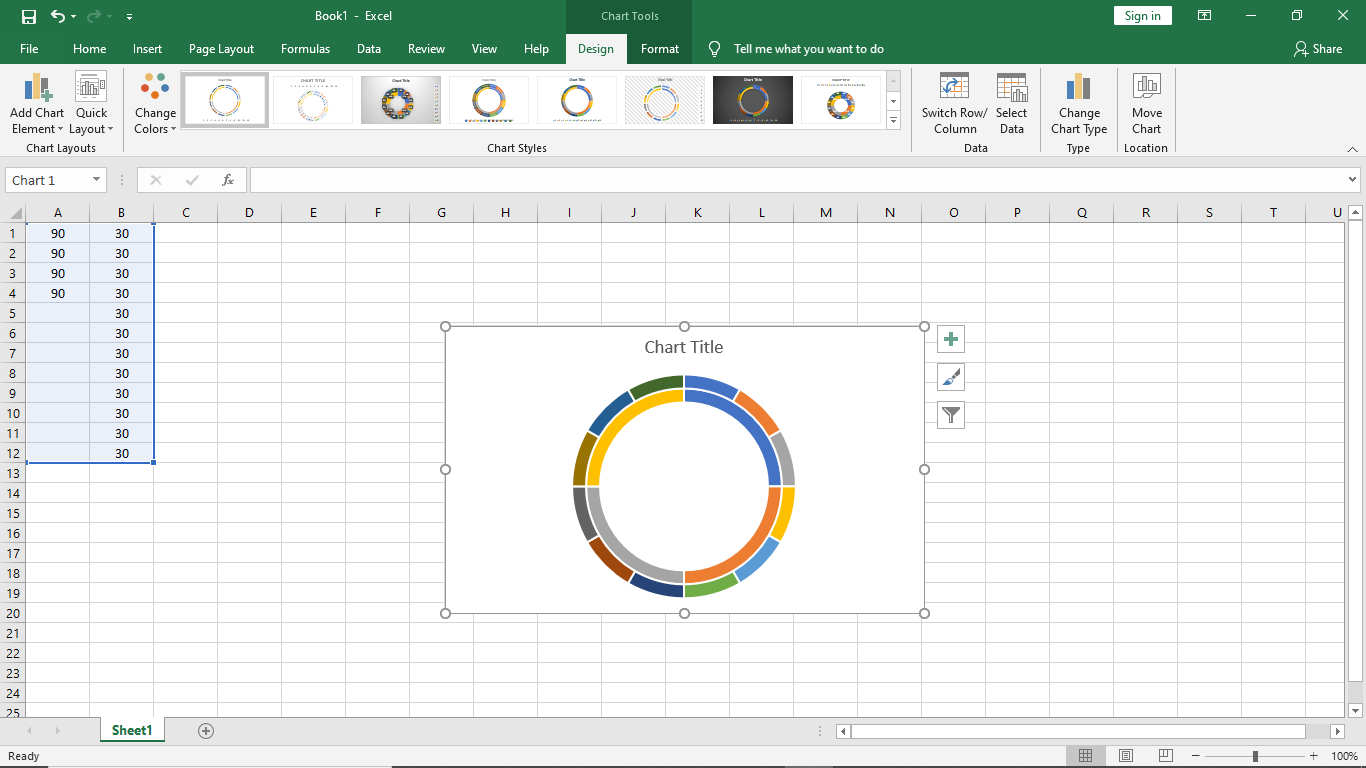
Step3: Delete the legend
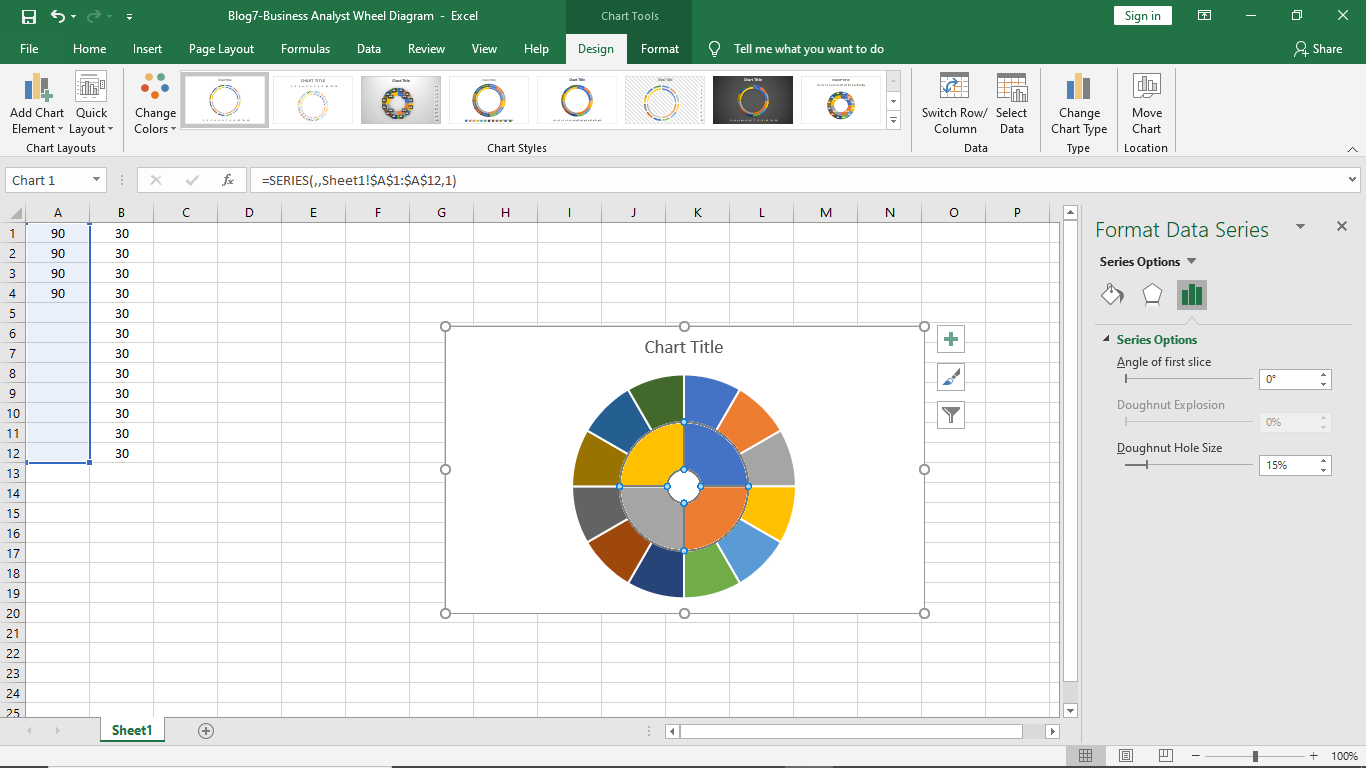
Step4: Select inner wheel, right click. Format Data Series -> Series. Reduce Doughnut hole size
Open PowerPoint
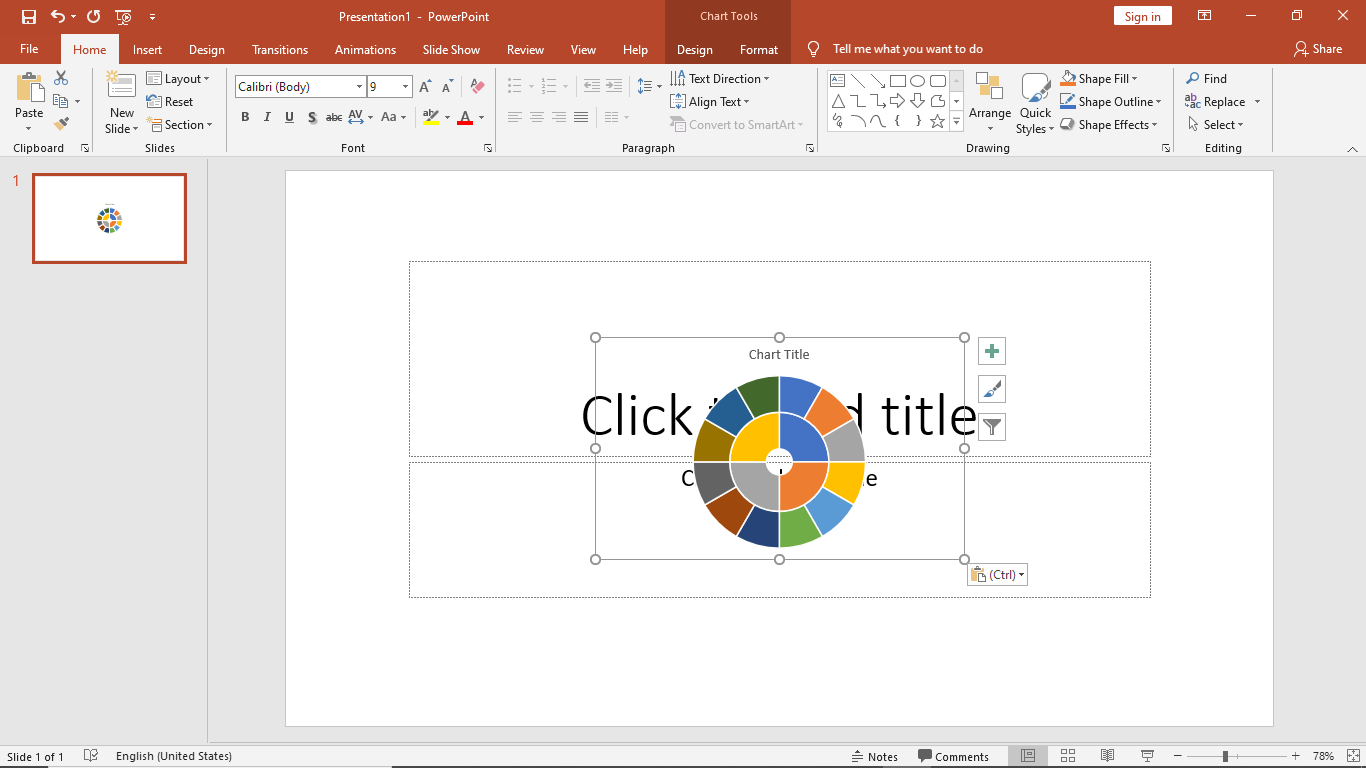
Step5: Paste the chart in PowerPoint
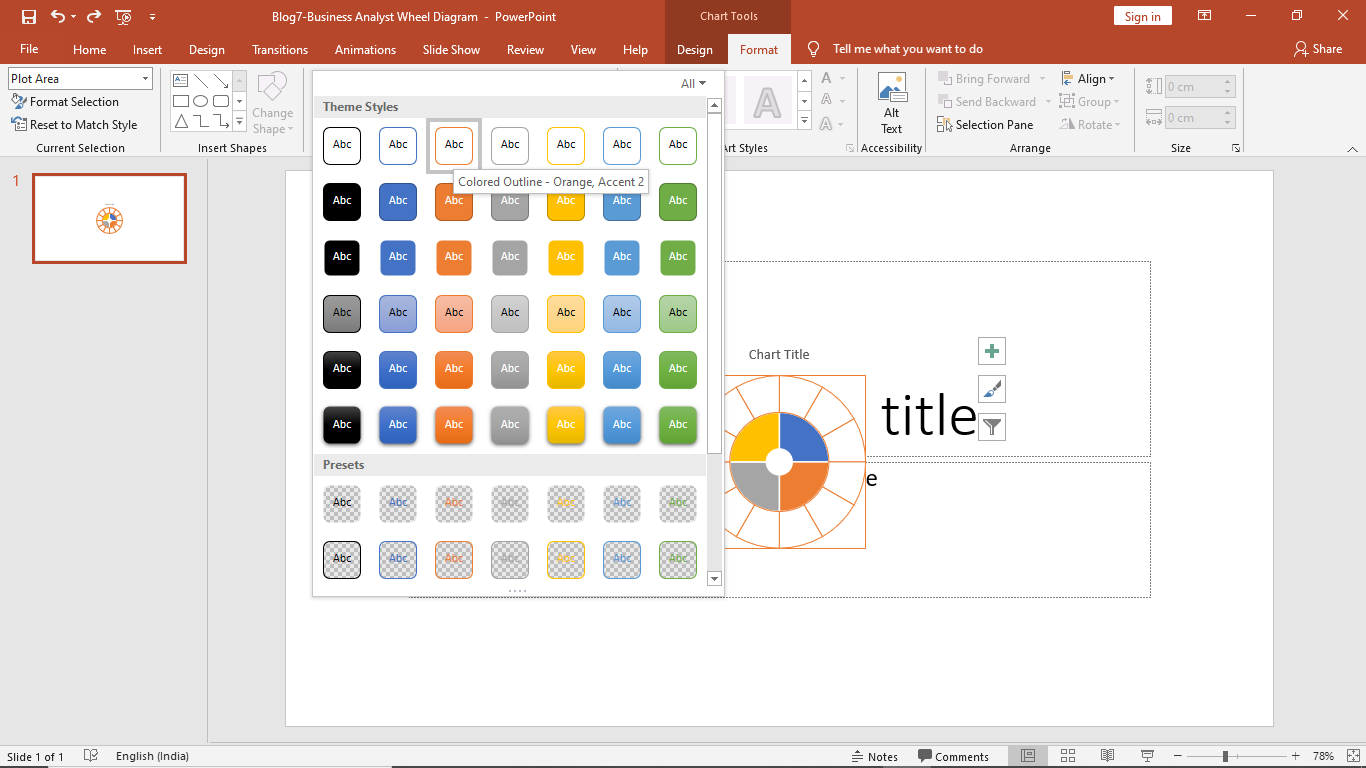
Step6: Select relevant ‘Shape Styles’ to format the circles
Step7: Enter Text
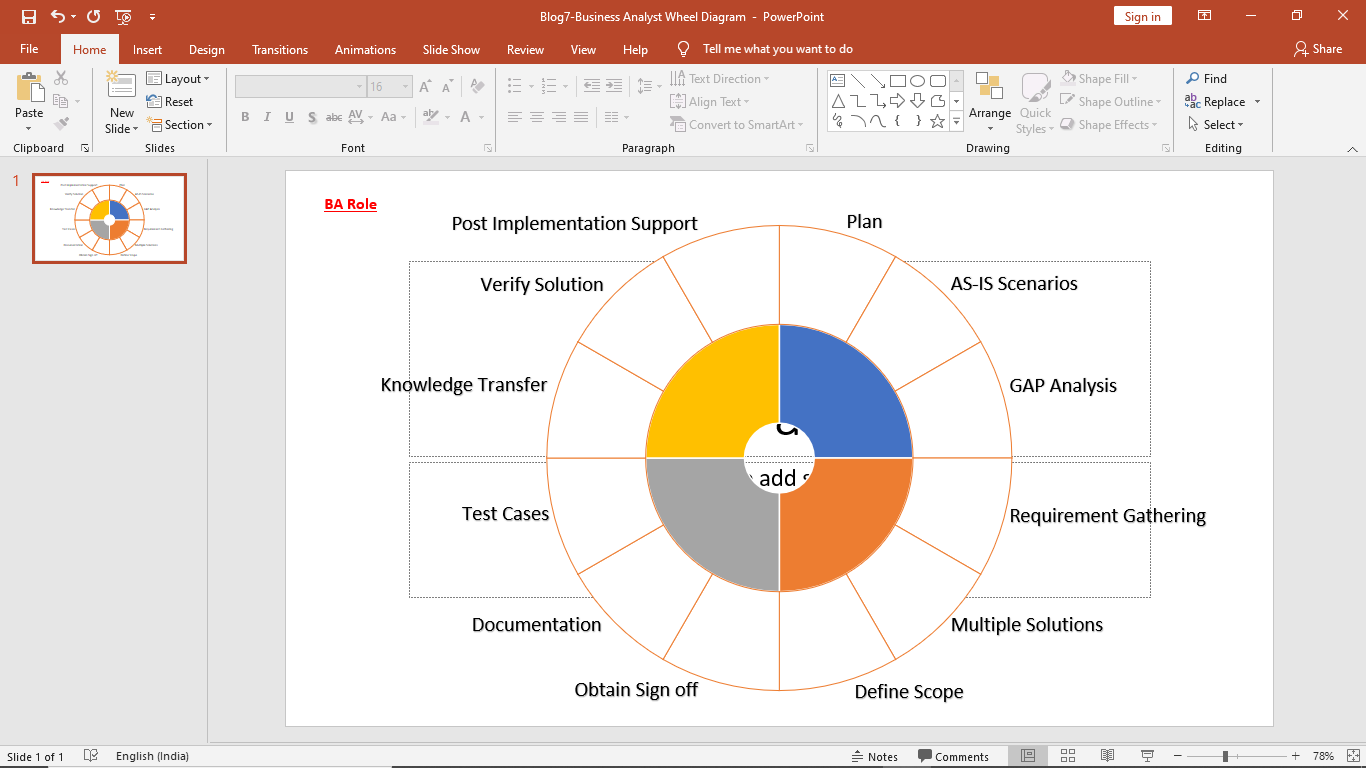
Step 8: Preview Slide
Scope of Usage
- Can be used to model a process cycle in PowerPoint
- Can be used to segments or show components of a central subject