Subject Line

You will enjoy using VLOOKUP with IF statement.

Overview

Sometimes you may need to look up data or values from multiple tables on the basis of some conditions using IF statements which are incredibly robust. In this case we use Vlookup along with IF statement to search the value as per your criteria. There could be possibilities of the conditions being recorded separately also; so the lookup criteria which would make your search operation slightly complex. Therefore, in order to simplify the search operation you can combine the ranges you wish to use for your conditions but only in case where you need to make logical comparison using minimal conditions you can make use of Vlookup along with IF statement.

Working

Let us understand the working with the same employee information (Figure 1: Employee Information) we have been using.  The below is the employee listing which also contains the list of Sales representatives for the company.
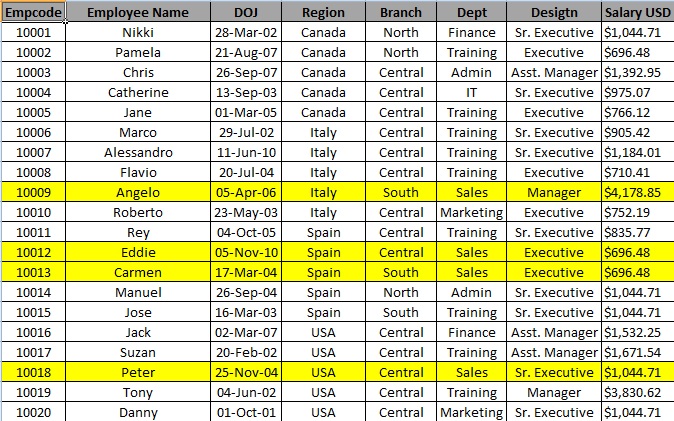


Figure 1: Employee Information


The employees have serviced for a particular number of years i.e. tenure. Its appraisal time and the management would want to work out the commission or incentives to be rewarded to the sales representatives of the company.

In the example we want to find the commission rate and the commission based on Sales amount i.e. the volume of Sales done by each employee and tenure in years i.e. the period for which the employee has been working with the company


Below (Figure 2: Criteria and Calculations);

Table A represents the Sales figures

Table B represents the applicable commission rate to be applied (for tenure less than 5 years)

Table C represents the applicable commission rate to be applied (for tenure more than 5 years)


Figure 2: Criteria and Calculations

Note: There are four employees (highlighted in yellow who are part of the Sales workforce for the company)

The other employees are part of the marketing teams and are being rewarded for the Sales recognized by the company due to their efforts on campaigns and marketing initiatives.

Step 1:  We will use Vlookup along with IF statement for finding the Commision Rate.

Below is the formula-

=VLOOKUP(C2,IF(B2<5,$H$3:$I$9,$K$3:$L$8),2,1)


Explanation to the commission rate formula

We want commission rate as per sales amount and as per tenure hence we use IF statement and if the tenure is <5 than Table B will become the Table array else it will take Table C and lookup 2nd column.

In simple words,

=IF (Something is true, then do something, otherwise do something else)

Note that we have mentioned 1 i.e. true which is approximate match.

=VLOOKUP(C2,IF(B2<5,$H$3:$I$9,$K$3:$L$8),2,1)


Step 2: Select the cell D2 to D11 and drag the formula using Ctrl+D.


Step 3:  Now we require Commission for each sales representative.

Formula for Commission is Sales * Commission rate (i.e. Column C X Column D)


Understanding how the formula works with the help of Evaluate Formula

Step 1: Select the cell (D2 in this case) that you want to evaluate. Only one cell can be evaluated at a time.

Step 2: On the Formulas tab click on Evaluate Formula in Formula Auditing group


Step 3:Evaluate Formula dialog box will appear.

Step 4: Click Evaluate to examine the value of the underlined reference. The result of the evaluation is shown in italics.

If the underlined part of the formula is a reference to another formula, click Step In to display the other formula in the Evaluation box. Click Step Out to go back to the previous cell and formula.
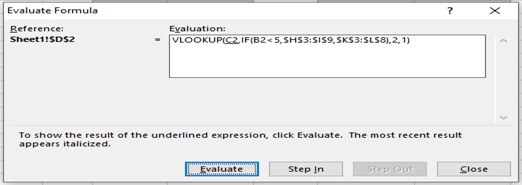

Step 5: After clicking on Step In button we get the lookup value.

Step 6: Click on Step Out
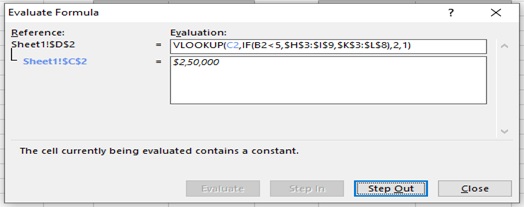

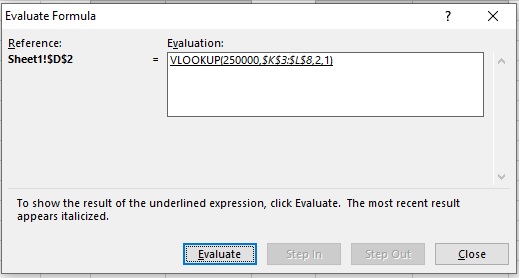
Step 7: Click on Evaluate

Step 8:IF condition gets executed (B2<5).
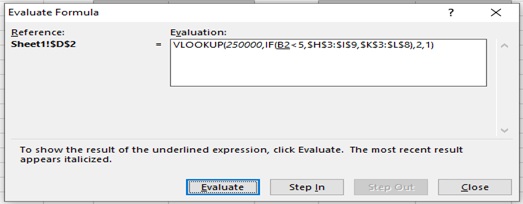

Step 9:Here value is 8 in B2
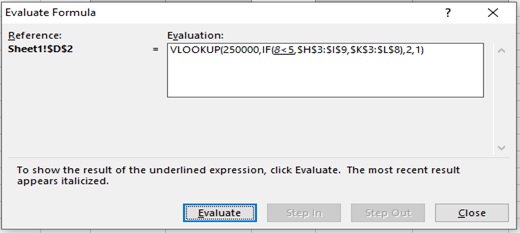

Step 10: Hence it reurns False
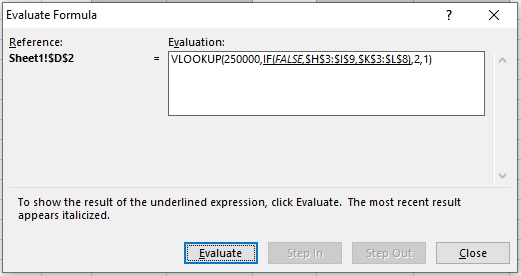


Step 11:  Hence it looks for Table B

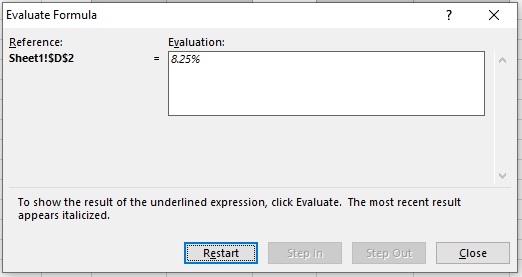
Step 12: Result (8.25%)


Scope of Usage:

ü  Should  be used with minimal conditions

ü  Not recommended to be used where IF statement is going to be rewritten

ü  Can be used in cases where co-relation between values are less likely to change

ü  Can be used in cases which will require less maintenance i.e. commission rate once defined is less probable to be changed

ü  Can be used with multiple tables

ü  Can be used to lookup with criteria i.e. different processing rules

ü  Can be used to find approximate match or exact match

ü  Can be used to define the table when the condition is met

ü  Can be used to define the table when the condition is not met


ü  Can be used to identify the data range

MASTER ADVANCED EXCEL FORMULAS

USED BY THE TOP 1% EXCEL EXPERTS
THAT ARE GUARANTEED TO GET YOU A 40 % RAISE
WITHOUT ANY PRIOR KNOWLEDGE AND IN JUST 3 HOURS

Please Check All Boxes Where Your Answer Is YES!

Here’s the deal:

You can learn Excel by watching random YouTube-videos and reading online tutorials…
… but it’s CRAZY inefficient (that approach took us 7 years!).
That’s why we have distilled all our knowledge into “Excel Logics”.

Donald Dellario

Got a 40% salary hike because of the Excel Logics Academy
i was using Microsoft Excel daily at work but my knowledge was limited to basic excel formulas.after i joined excel logic advanced excel formulas Excel Logics Academy,i learn advanced excel,became more confidant at work & this helped me get 40% salary hike in just 2 months.if u feel stuck at works, feel demotivated or want to grow your career quickly,this Excel Logics Academy is the only think you need.

Robin Ward

Finally became a pro in Excel by learning from the Excel Logics Academy herself. I am not sure if this is really happening or not. I started using the formulas Excel Logics taught us & created my reports in just 20 minutes. Before the Excel Logics Academy, used to do everything manually and took almost 3 hours for it. You have been a life saver, keep up the great work, sir

Stan Gilbert

Best thing to happen to my career! This Excel Logics Academy was an eye-opening journey for me. Can’t believe there were these many wonderful formulas in excel that wouldn’t have learned had I not attended this Excel Logics Academy! Before this Excel Logics Academy I knew only 1% of excel and thus, I had to work unnecessarily hard. Trust me upon completing this Excel Logics Academy, you will find working on excel very easy and fast. Definitely a must-join & 10x value for money!

Linda Michaels

Thanks for making me work less at my job Almost 50% of my work day is spent on Excel. I learnt over 15 Advanced Formulas in Excel in this Excel Logics Academy that now helps me save over 70-90 minutes daily. Thanks for making me work less, haha. You’re the best in Excel & I am glad that you’re my Mentor

Topics covered in Excel Logics

Designed for Excel Logics
Excel Logics is designed for Excel Logics – Excel 2019, Excel 2016, Office 365. While you can practice the concepts in older versions of Excel, to get the most out of it, use latest version of Excel or Office 365.

Getting Started

Intro to Excel
Setting up tables
Cleaning bad data
Cleaning using Power Query
Writing formulas
Creating pivot tables
Making charts
Filtering & sorting
Shortcuts

Data + Tables + PQ

Excel Tables
Filtering, slicing tables
Bad data to good with PQ
Unpivoting data with PQ
Merging multiple files to one table

Writing Formulas

Referencing data
IF condition, CHOOSE, IFS
Statistical analysis
Conditional sum, count
Lookups
Advanced Lookups
Date formulas
Text analysis
Sentiment analysis
Exploratory data analysis

Making Pivot Tables

Creating pivot tables Data model + relationships Multiple table pivots Customizing pivots Extra calculations in Pivots Grouping data Slicing and dicing GETPIVOTDATA

         Adv. Pivot Table bonus

Charts + Graphs

Intro to Charting
Picking right charts
Anatomy of Excel chart
Formatting charts
New charts in Excel 2016
Budget vs. Actual charts
Then vs. Now charts
Conditional charts
Sparklines
Interactive charts

Advanced Concepts

Data validation
Creating templates
Workbook protection
Publishing to web
Shapes + pictures
Navigation buttons
Priting
Form controls
Custom ribbons

Optional module on

Dashboards

What is a dashboard?
Process for dashboards
Business dashboard #1
Business dashboard #2
Business dashboard #3
Employee Dashboard
Financial metrics dashboard
KPI Dashboard
Web enabled dashboard

Excel Dashboards

Dashboards from Excel Logics

Previous
Next


Excel Logics Academy

online + download access

  $ 147

      •    6 modules of Adv. Excel Lessons
      •   40+ example workbooks
      •   2 years online access
      •    Download HD quality videose
      •   Formula cheat sheet
      •   Shortcuts poster
      •   30 day money back guarantee

  • Excel Logics Dashboards

    Dashboards online + download access

      $ 227

        •    6 modules of Adv. Excel Lessons
        •  Extra module on Dashboards
        •   70 lesson videos
        •    50+ example workbooks videose
        •    Lifetime access
        •    Download HD quality videos
        •   Formula cheat sheet
        Shortcuts poster
    •   30 day money back guarantee


    Excel Logics Academy

    online + download access

      $ 147

      •    6 modules of Adv. Excel Lessons
      •   40+ example workbooks
      •   2 years online access
      •    Download HD quality videose
      •   Formula cheat sheet
      •   Shortcuts poster
      •   30 day money back guarantee

  • Excel Logics Dashboards

    Dashboards online + download access

      $ 227

        •    6 modules of Adv. Excel Lessons
        •  Extra module on Dashboards
        •   70 lesson videos
        •    50+ example workbooks videose
        •    2 years online access
        •    Download HD quality videos
        •   Formula cheat sheet
          Shortcuts poster
      •   30 day money back guarantee

    FAQ

    Most frequent questions and answers

    You are welcome to view the videos at https://career-growth.co/excel-tutorials/, which is the website address where we have compiled them for your convenience.

    If you – for WHATEVER reason – don’t think Excel Logics is worth the cost, send me an email within the first 30 days and I’ll refund you immediately. You are 100 % Protected & safe. 


    All of us want to excel in our fields. Microsoft Excel is a very powerful tool which is evolving for the future. We therefore as readers, users and professionals also need to be prepared for the future and strengthen our knowledge of Microsoft Excel. If they say data is the new oil then Microsoft Excel would be an oilfield.
    Today Microsoft Excel is widely used across all sectors predominantly in financially-related activities and is a pre-requisite for anyone who wants to be in a critical role in an organization. Big opportunities and bigger fortunes are there for those who take up their learning seriously which can move them ahead of others.
    Organizations closely monitor the performance of employees and reward deserving employees for their achievements. At some point in time in your career you would be required to demonstrate your excel skills which would establish you as a core professional within the organization. Your career growth would be rapid and you would have an advantage over others with Microsoft Excel as one of your skill sets.
    Do you want to create a long lasting impression in your organization? Remember the real recognition and appreciation will come when you work smart and you can work smarter by using Microsoft Excel. You can become an inspirational leader for each and everyone in your organization.
    The use of excel can have a greater impact on your other skills also. Since Microsoft Excel can be used as a planning tool it would help you to plan efficiently and effectively. The journey to learning Microsoft Excel is a long one. It needs meticulous planning, preparation and action and focussed direction. The multiple features of Microsoft Excel will help to enhance your skills.
    To work with Microsoft Excel you need to follow a structured approach to your learning. Our tutorials are designed by professionals who have worked in various roles and have essential knowledge to be able to design modules for most sought and frequently utilized topics in your work place. We follow a structured approach to design the training programs which are easy to follow by beginners or advanced professionals.
    You will learn how to create strong added value to your business or area of work. You have multiple options right from applying the learning in your day to day operations at work and you become more employable if you are searching for a short term or long term opportunity.
    The employers see you as a person who has mastered an important software application and this gives them an impression that you may be willing to further learn additional skills to support their business.
    Our focal courses are designed as multimedia learning wherein the learner employs both auditory and visual stimuli to learn information on Microsoft Excel. Our courses provide “Synchronous learning” in real- time and is supported by asynchronous learning activities.
    Our focal blogs and videos are designed, developed and delivered (D3) through a tailor made DDAR model – Design, Delivery, Assessment and Relationship management model which is the best model for the learners of the 21 st century.
    The blogs and downloads can be used by you to facilitate your learning in a simple way and with the videos which can be viewed on different video supported portable devices you can perform the same steps in parallel. The videos would serve as an assistant to help you complete the steps for the topics.
    The validation units are designed to include pop-up quizzes, multiple choice assessments, graded essays, end of course assessments, case studies, mini projects and end-of-course projects which provide a quantitative and qualitative assessment of the learners.
    We cover A-Z of the concepts and topics on Microsoft Excel. Some of them are as below

    Analysis, Basics, Calculations, Dashboards, Examples, Formula and Functions, Graphs, Highlighting, Index, Joins, Know hows, Lookup, Macros, New Features, Options, Pie Charts and Pivot, Queries, Reference, Shortcuts and Statistics, Tips and Tricks, Usability, Variables and What If Analysis
    The course is designed for anyone who works with Excel models and performs Financial Analysis. As it is designed for Financial Analysts in Investment Banking, Equity Research, FP&A and corporate development it would help you to make your analysis more dynamic and powerful and position you as a world class financial analyst.
    The downloaded content is compatible with all versions of Excel and can be saved as per the version you operate with. It supports Excel 2007 to 2016 for Android, Mac OS and Windows
    You would be able to use the examples for Mac Excel as the examples are designed using Office 365.

    Yes you just have to pay once to avail all the offerings of Excel logics including access to the blogs,
    training videos, business cases and message boards. You can also get complete information on planned
    training programmes and we can accommodate your flexible schedules.

    If you put in the work but don’t feel like you’re making progress, it’s our fault – not yours. We stand by this course with a 30-day 100% money-back guarantee. Try the entire training and decide if it’s right for you. If it for whatever reason isn’t the right fit you for, send us an email and we will refund you.
    No, there is no need to renew as it is onetime payment and it is valid for life time access.
    Yes for 3 years you will get 24 X 7 support via email

    Topics covered in Excel Logics

    Designed for Excel Logics
    Excel Logics is designed for Excel Logics – Excel 2019, Excel 2016, Office 365. While you can practice the concepts in older versions of Excel, to get the most out of it, use latest version of Excel or Office 365.

    Getting Started

    Intro to Excel
    Setting up tables
    Cleaning bad data
    Cleaning using Power Query
    Writing formulas
    Creating pivot tables
    Making charts
    Filtering & sorting
    Shortcuts

    Data + Tables + PQ

    Excel Tables
    Filtering, slicing tables
    Bad data to good with PQ
    Unpivoting data with PQ
    Merging multiple files to one table

    Writing Formulas

    Referencing data
    IF condition, CHOOSE, IFS
    Statistical analysis
    Conditional sum, count
    Lookups
    Advanced Lookups
    Date formulas
    Text analysis
    Sentiment analysis
    Exploratory data analysis

    Making Pivot Tables

    Creating pivot tables Data model + relationships Multiple table pivots Customizing pivots Extra calculations in Pivots Grouping data Slicing and dicing GETPIVOTDATA

             Adv. Pivot Table bonus

    Charts + Graphs

    Intro to Charting
    Picking right charts
    Anatomy of Excel chart
    Formatting charts
    New charts in Excel 2016
    Budget vs. Actual charts
    Then vs. Now charts
    Conditional charts
    Sparklines
    Interactive charts

    Advanced Concepts

    Data validation
    Creating templates
    Workbook protection
    Publishing to web
    Shapes + pictures
    Navigation buttons
    Priting
    Form controls
    Custom ribbons

    Optional module on

    Dashboards

    What is a dashboard?
    Process for dashboards
    Business dashboard #1
    Business dashboard #2
    Business dashboard #3
    Employee Dashboard
    Financial metrics dashboard
    KPI Dashboard
    Web enabled dashboard

    Excel Dashboards

    Dashboards from Excel Logics

    Previous
    Next


    Excel Logics Academy

    online + download access

      $ 147

      •    6 modules of Adv. Excel Lessons
      •   40+ example workbooks
      •   2 years online access
      •    Download HD quality videose
      •   Formula cheat sheet
      •   Shortcuts poster
      •   30 day money back guarantee

  • Excel Logics Dashboards

    Dashboards online + download access

      $ 227

        •    6 modules of Adv. Excel Lessons
        •  Extra module on Dashboards
        •   70 lesson videos
        •    50+ example workbooks videose
        •    Lifetime access
        •    Download HD quality videos
        •   Formula cheat sheet
        Shortcuts poster
    •   30 day money back guarantee


    Excel Logics Academy

    online + download access

      $ 147

      •    6 modules of Adv. Excel Lessons
      •   40+ example workbooks
      •   2 years online access
      •    Download HD quality videose
      •   Formula cheat sheet
      •   Shortcuts poster
      •   30 day money back guarantee

  • Excel Logics Dashboards

    Dashboards online + download access

      $ 227

        •    6 modules of Adv. Excel Lessons
        •  Extra module on Dashboards
        •   70 lesson videos
        •    50+ example workbooks videose
        •    2 years online access
        •    Download HD quality videos
        •   Formula cheat sheet
          Shortcuts poster
      •   30 day money back guarantee