Subject Line
Combo offer for charts
Overview
Sometimes you may have to show different type of information on a single chart. You will have to combine two or more charts in a single chart. We can use Combo chart in excel to create such charts. It is like a combo offer where you can enjoy the benefits of two offers in one offer.
Working
Let’s understand the working with an example.
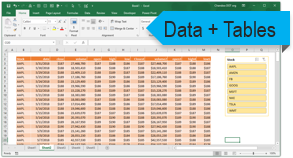
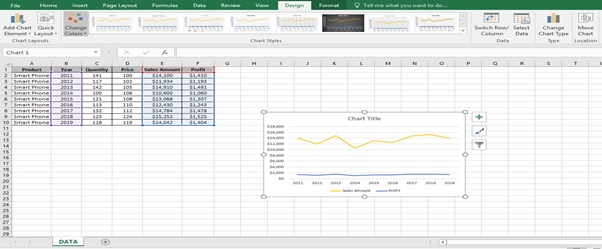
We have (Figure 1: Sales data of Smart Phone) from the year 2011 till 2019.
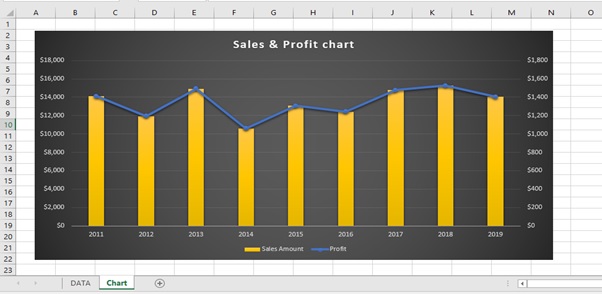
You have to create a chart showing the Sales and profit made by Smart Phone each year in one single chart.
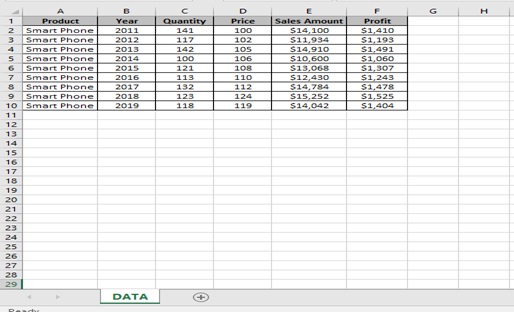
Figure 1: Sales data of Smart Phone
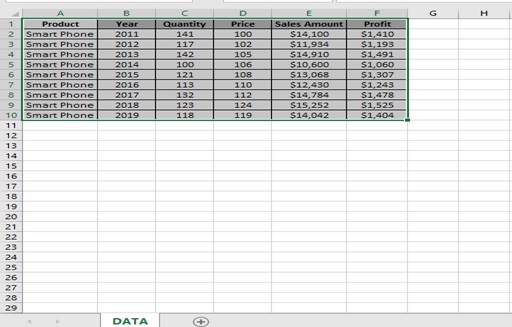
Step 1: Select the Sales table A1 to F10
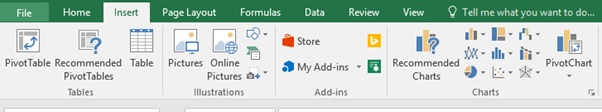
Step 2: Click on INSERT tab
Step 3: Click on Recommended Charts
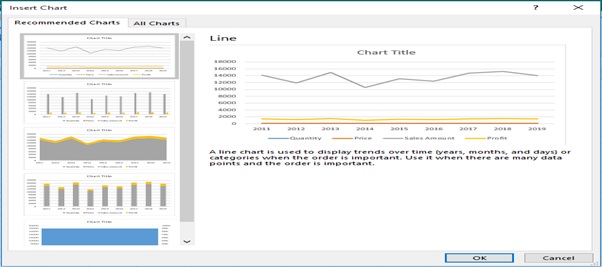
Step 4: Insert Chart dialog box appears
Step 5: Click on All Charts tab
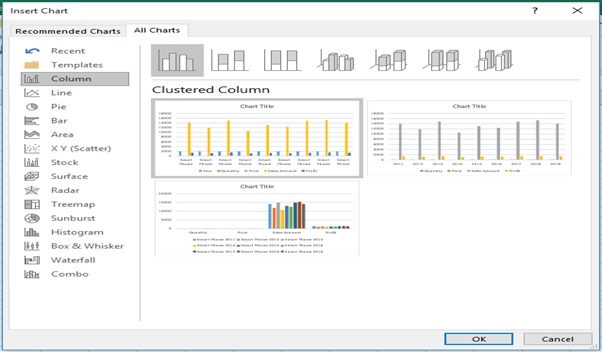
Step 6: Click on Combo
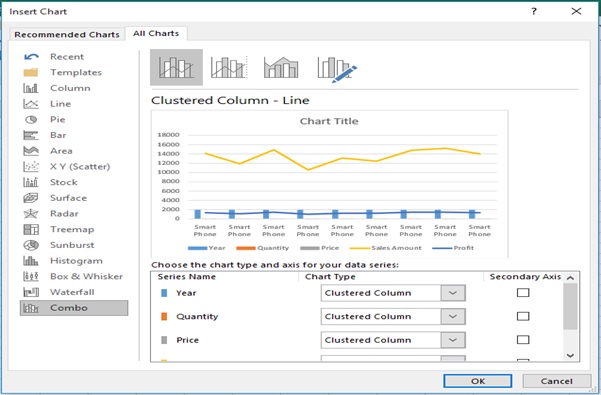
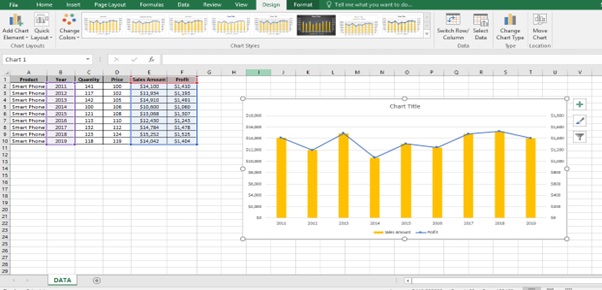
Step 7: Combo Chart appears
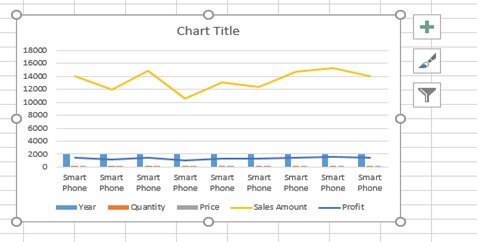
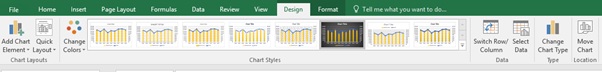
Step 8: Go to Design
Step 9: Click on Select Data
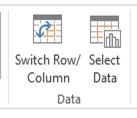
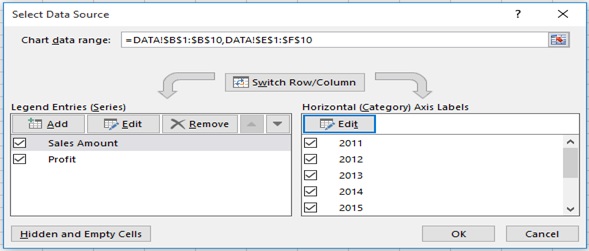
Step 10: Select Data Source dialog box appears
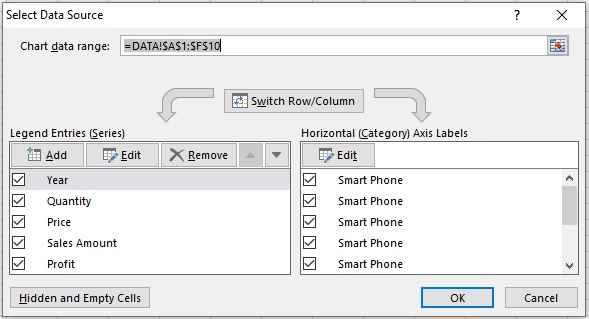
Step 11: Select Year from Legend Entries (Series) and click on Remove button
Step 12: Select Price from Legend Entries (Series) and click on Remove button
Step 13: Select Quantity from Legend Entries (Series) and click on Remove button
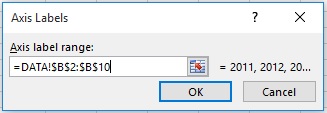
Step 14: From Horizontal (Category) Axis Labels click on Edit
Step 15: Select the Year from B2 to B10
Step 16: Click on OK
Step 17: Click on OK
Step 18: Go to Design Tab
Step 19: Click on Change Chart type
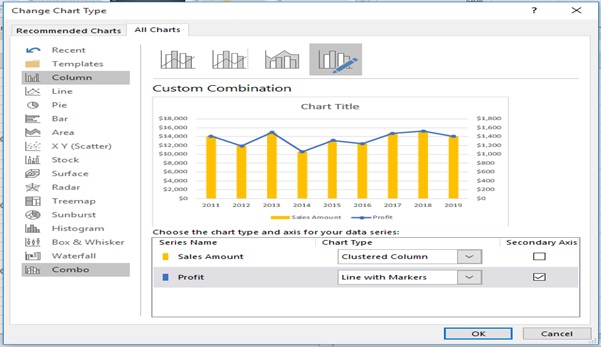
Step 20: Change Chart Type dialog box appears
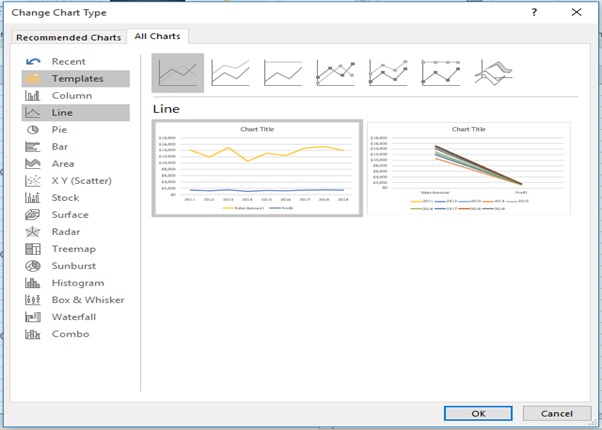
Step 21: Click on All Charts
Step 22: Select Clustered Column chart type for Sales Amount.
Step 23: Select Line with Markers chart type for Profit
Step 24: Select the Secondary Axis tick box for Profit
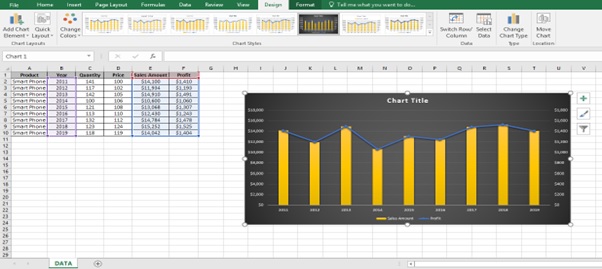
Step 25: Select Style 6 from Chart Styles from Design tab
Step 26: Create a sheet named Chart
Step 27: Combination chart is prepared
Step 28: Go to Design tab
Step 29: Click on Move Chart tab
Step 30: Move Chart Dialog Box appears
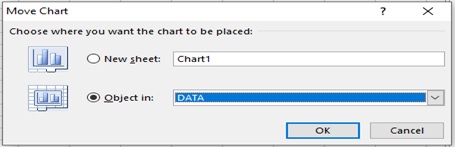
Step 31: Select Chart in Object in dropdown
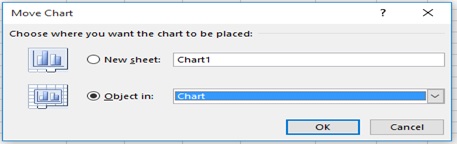
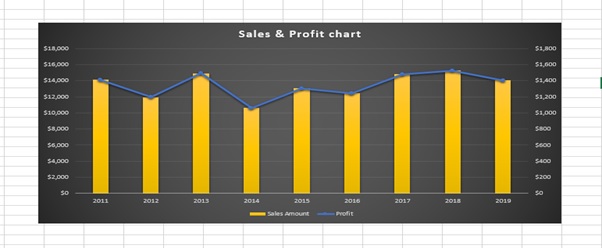
Step 32: Combination chart moves to Chart sheet
Scope of Usage
- Can be used to combine two charts
- Can be used for better analysis
- Can be used to represent more values in a single chart
Can be used for clear data points